
Albert D. Bates, Profit Planning Group
This report analyzes the profitability and operational statistics for distributors in 28 lines of trade, focusing on results for 2015. The goal is to help distributors understand the change in financial performance across all of distribution and for their specific industries, as well.
The analysis focuses on five critical profit variables (CPVs): 1) sales growth; 2) the gross margin percentage; 3) the operating expense percentage 4) inventory turnover; and 5) the average collection period (often called the days sales outstanding). These factors combine to produce profit for individual firms and individual lines of trade.
In analyzing the CPVs, two conflicting realities quickly emerge. Namely, distributors are all the same and they are all different. They are all the same in that there is price competition in every industry, employee productivity is always a challenge, and the like. In short, all distributors try to improve internal operations. This makes even small, year-over-year improvements in the CPVs critical.
Distributors also are different in their financial results, even given their common concerns. For the 28 lines of trade in distribution, wide variations exist in nearly every important metric in determining overall profitability. For example, the lowest gross margin percentage for any line of trade in this analysis is 6.5 percent of sales, and the highest is 47.3 percent.
Such differences make it difficult but not impossible to compare performance across lines of trade. The analysis cannot simply look at how one industry’s gross margin compares with other industries. Some adjustments must be made to allow for direct comparisons. The methods required to make comparisons are covered in the Methodology section.
Methodology
This report focuses on two issues. First, how well did individual lines of trade do on key performance metrics in 2015? Second, to what extent did those metrics change by line of trade between 2014 and 2015? In short, how good are the results, and how much did the results change?
It is impossible to put high-gross margin industries together with low-gross margin ones and come to any conclusion. The gross margin numbers, along with inventory turnover and the like, must be converted to some common denominator to make conclusions possible. The conversion process is straightforward but decidedly alien to distribution management.
The procedure employed here involves converting absolute metrics into percentage change metrics. The percentage change figures measure how much better or worse a specific industry performed in 2015 vs. 2014. This allows an analysis of which industries are improving and which are not.
For example, if an industry with an average inventory turnover of two times experienced a 0.5 turn improvement in 2015, the percentage improvement in turnover was 25 percent (0.5 x 2 = 25 percent). In an industry with five turns per year as a starting point, the same 0.5 turnover improvement would represent only a 10 percent improvement.
To compare across industries, all of the annual changes between 2014 and 2015 for gross margin, operating expenses, inventory turnover and the DSO were converted to percentages. In that way, the percentage increase, or decline, is directly comparable to other industries. The focus always is on how much better or worse an industry performed.
ROA Trends for the Past Five Years
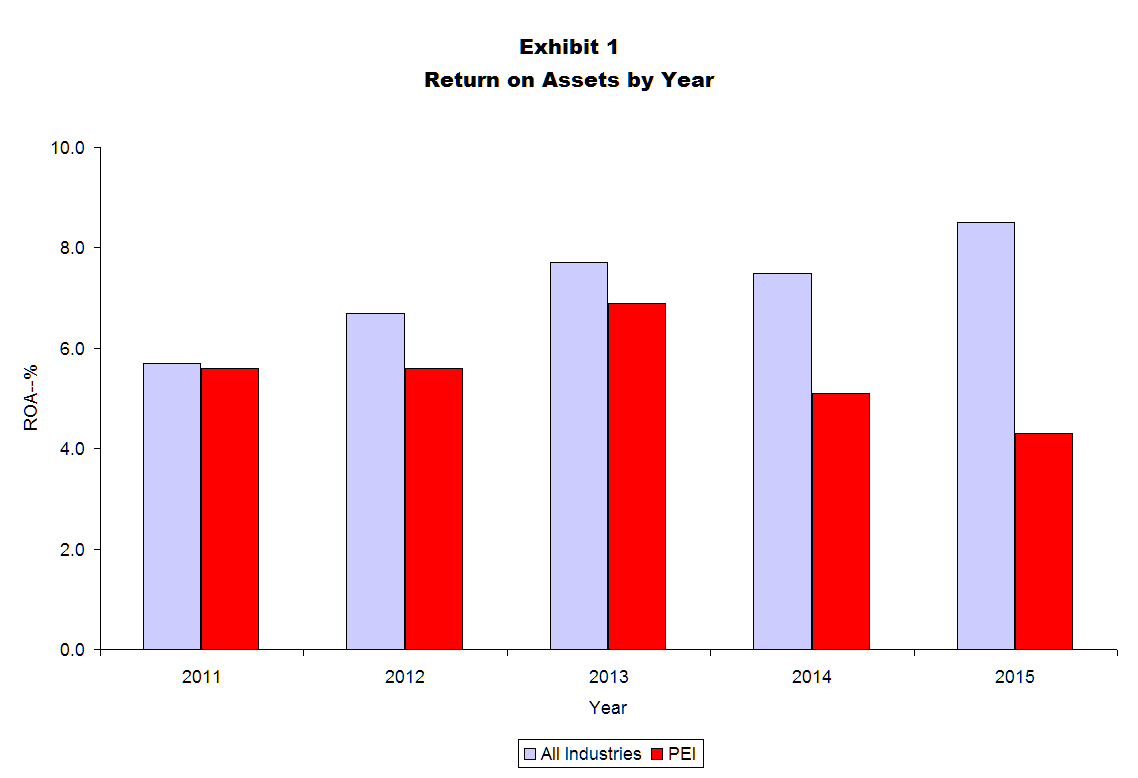
Before examining the individual CPVs, it is useful to measure overall profit performance (that is, how well did distributors combine the CPVs). Exhibit 1 does this by examining return on assets (ROA) for the past five years for which information is currently available.
ROA is calculated by taking pretax profits and dividing by total assets. For distributors, ROA is the best overall measure of profitability. Most analysts argue that an ROA of at least 5 percent is essential for long-term success. For distribution, anything in excess of 10 percent would be considered outstanding.
Exhibit 1 outlines the median ROA performance for the 28 lines of trade for 2011 through 2015. The overall pattern reflects a modest but important improvement in ROA between 2011 and 2013, followed by a flattening in results after that. Even with the flattening, the ROA for 2015 was the highest in the five-year time frame, coming in at 8.5 percent.
The exhibit also provides comparison figures for PEI members during this period (equipment-oriented firms). Specifically, PEI members followed a roller coaster pattern regarding ROA. The figure rose nicely in 2012 and 2013, then fell sharply after that. It is now the lowest in five years.
Sales Growth by Industry Segment
The ability to increase sales systematically is a key profit driver. Still, the importance of sales growth is somewhat overstated. Exceptional rates of growth are not required. Needed is enough growth to allow the firm to offset the impact of inflation on expenses with some relative ease.
Different segments of distribution often produce different rates of growth. Consequently, for this analysis (and all of the other CPVs), performance is broken out by three global industry segments:
- Industrial. Distributors selling largely to “the factory floor.”
- Construction. Businesses selling primarily to contractors.
- Consumer. Entities selling consumer products or products that facilitate the sale of consumer products.
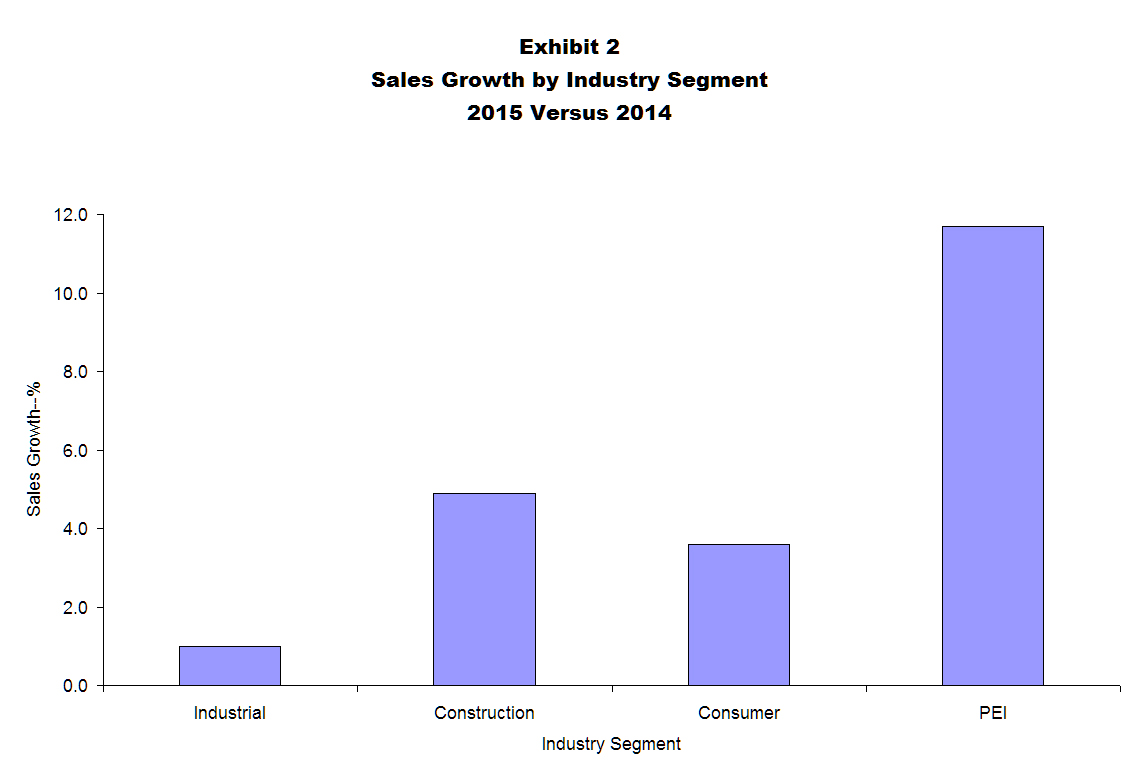
Exhibit 2 reflects a reality of distribution in today’s environment — virtually every segment is mature with modest rates of growth. In today’s moderate inflation environment, growth of somewhere around 5 percent is considered sufficient to help firms offset expense increases and enhance profit. For 2015, no segment achieved this level.
The industrial segment was especially hard hit in growth, coming in at only 1 percent. Construction enjoyed the highest growth rate but still fell short of the 5 percent mark, with growth of 4.9 percent. No industry was able to count on rapid growth to drive higher profit; they had to focus on the other CPVs.
For PEI members, sales growth was 11.7 percent during 2015. This made PEI a leading segment in growth. This should have helped generate an increase in ROA.
Gross Margin Changes by Industry Segment
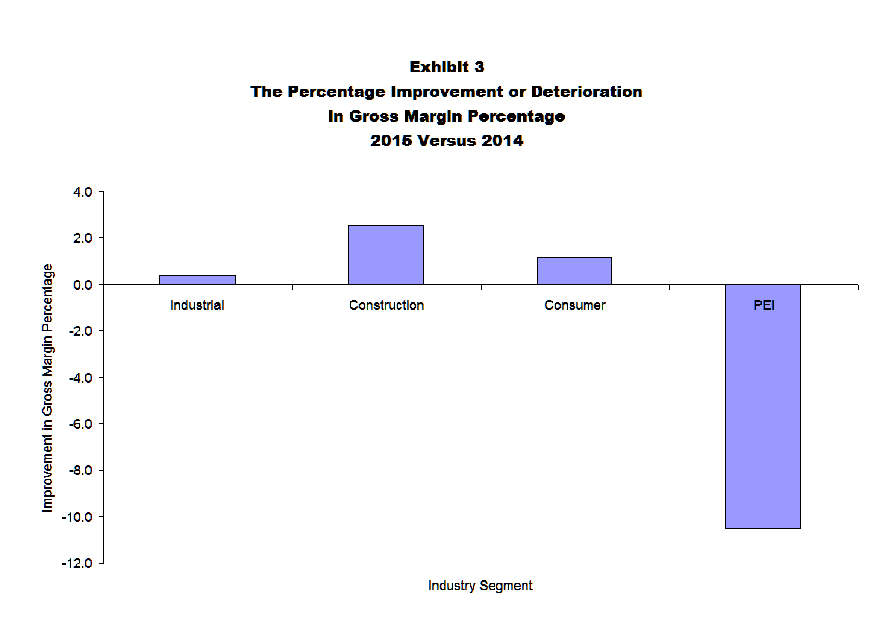
Exhibit 3 indicates 2015 was characterized by important improvements in gross margins. This was true across all three global industry segments; however, individual lines of trade within those segments experienced significant deviations from the norm.
Remember from the methodology how the changes in gross margin are calculated. In 2014, the median gross margin percentage for PEI members was 25.7 percent of sales. In 2015 it was 23 percent. This means that between 2014 and 2015, there was a change of negative 2.7 percentage points. The relative change was negative 10.5 percent (-2.7 x 25.7). It is not unusual to have a gross margin decline during rapid sales growth; however, this decline is significant. Gross margin is a major concern for the industry.
Any gross margin change, even if it appears small, is critical. The ratio reflects the change in the gross margin dollars that the typical firm would have experienced had sales remained constant. Although the numbers are typically small, their profit impact is large.
Improvements in the gross margin percentage are especially important in mature industries where sales growth tends to be modest. Every sales dollar must generate the maximum margin dollars to cover expenses and generate a profit.
Operating Expense Changes by Industry Segment
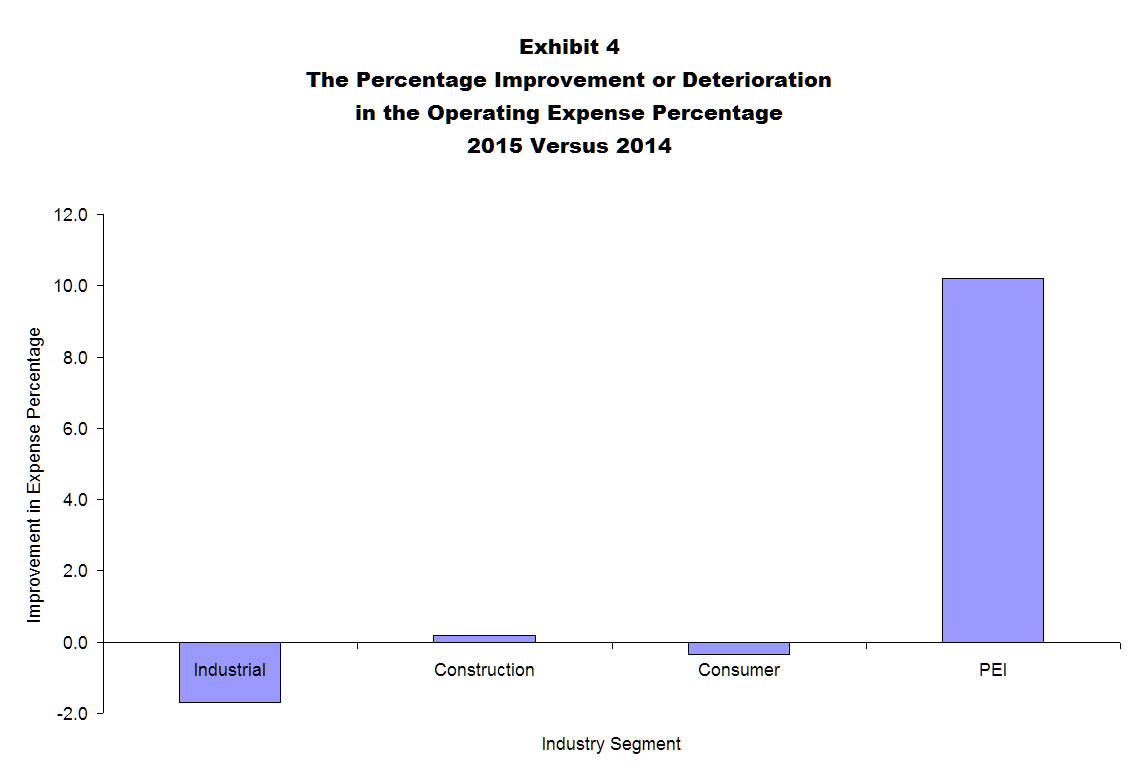
Exhibit 4 tracks the improvement or deterioration in operating expense percentages. That means that all positive numbers reflect doing better regarding operating expenses (expenses as a percent of sales declined). Any negative numbers indicate an increase in the operating expense percentage.
Clearly, 2015 was an operating expense challenge. For two of the three segments, operating expense performance deteriorated. The expense challenges tended to offset the gross margin improvements outlined in Exhibit 3.
In general, changes in operating expense percentages are heavily influenced by the rate of sales growth. The industrial segment had very modest sales growth. This led fairly directly to the decline in expense performance identified in the exhibit. The changes for construction and consumer segments also track closely with sales growth results.
For PEI members, there was a 10.2 percent positive relative change in the operating expense percentage. Specifically, operating expenses were 23.5 percent of sales in 2014 and 21.1 percent in 2015, resulting in a change of negative 2.4 percent. This means that the operating expense percentage got better by this amount. (As a result, the relative change was 2.4 percent ÷ 23.5 percent = 10.2 percent better than the previous year.)
The improvement in expenses largely, but not completely, offset the decline in gross margin. The improvement probably can be traced directly to rapid sales growth.
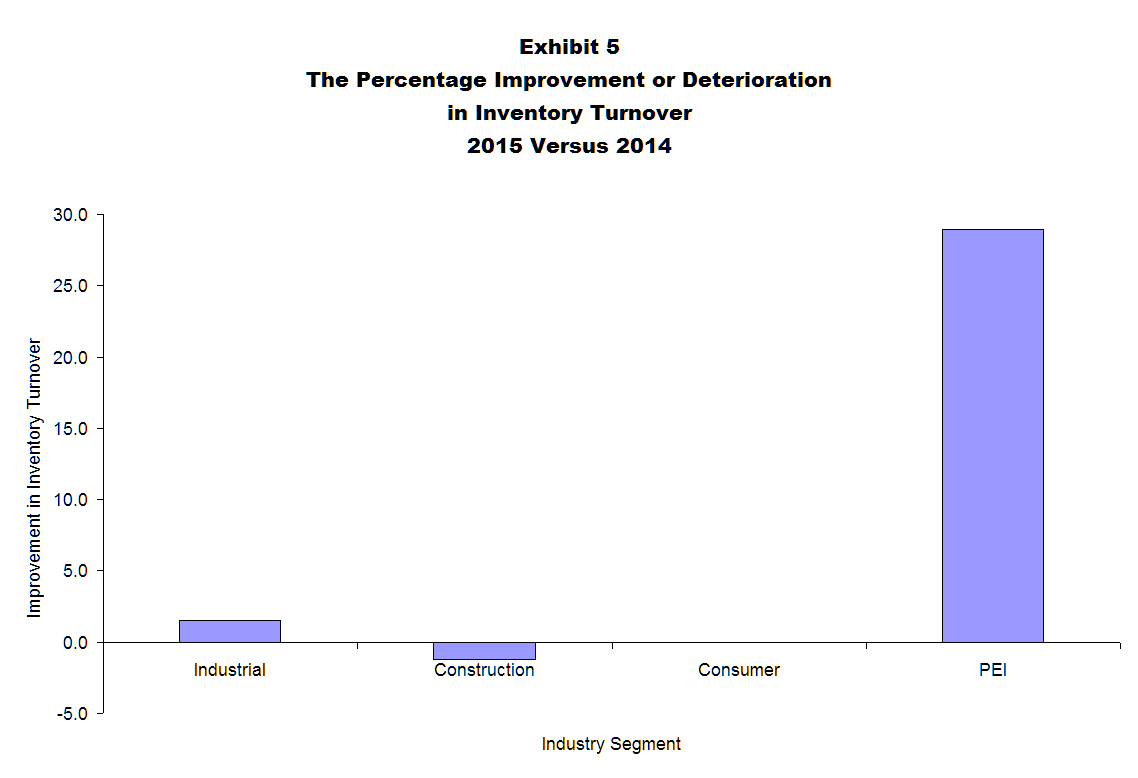
Inventory Turnover Changes by Industry Segment
Despite popular mythology, neither inventory turnover nor the days sales outstanding have a very large impact on profitability for distributors. They do have a large impact on cash flow. Both ratios must be viewed in that particular context.
Exhibit 5 indicates that the changes in inventory turnover levels followed no clear pattern in 2015, with industrial performing better, construction doing worse and the consumer segment experiencing no change. For PEI members, there was a change of 28.9 percent.
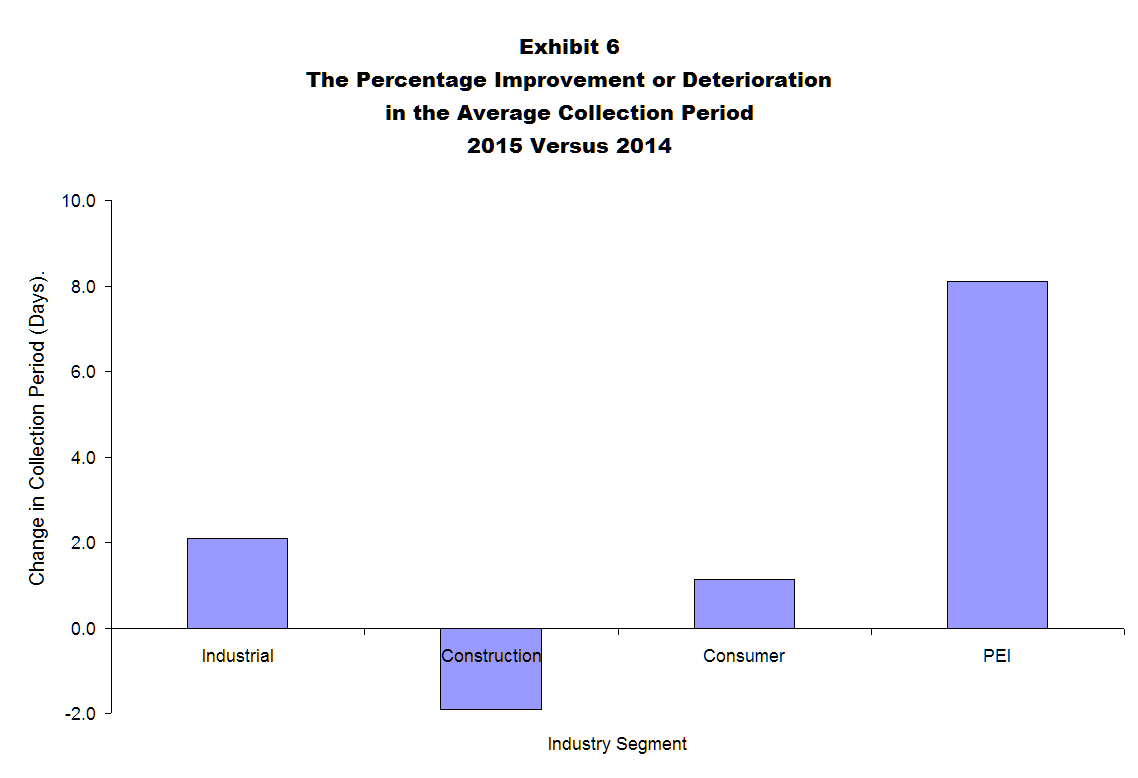
The Average Collection Period Changes by Industry Segment
Before reviewing Exhibit 6, note that all of the positive figures on the graph represent a decrease in the average collection period (or DSO). That is, they represent an improvement. The collection period is an extremely volatile ratio year to year. It is affected not only by management actions, but unusual sales activity that might occur toward the end of the fiscal year.
Like inventory, there was no clear pattern across all industries for the collection period. Again, this reflects the natural volatility of this ratio. For PEI members, there was a change of 8.1 percent.
Albert D. Bates, Ph.D., is the founder and director research of Profit Planning Group. He is the author of the newly released “Breaking Down the Profit Barriers in Distribution” available through Amazon and Barnes & Noble.